
The ADD blog provides insight into the ADD project’s research across six university partners. Meet our researchers from Aalborg University, Aarhus University, Copenhagen Business School, Roskilde University, the University of Copenhagen, and the University of Southern Denmark. Read about their projects, activities, ideas, and thoughts – and gain a new perspective on the controversies and dilemmas we face in the digital age, along with ideas on how to strengthen digital democracy.
By Professor and Co-Principal Investigator Christina Lioma, tenure track assistant Professor Maria Maistro and Ph.D. student Theresia Veronika Rampisela, University of Copenhagen
How does one measure the weight of an object? An easy way is to use a weighing scale. Most of the time, we trust that such scales come pre-calibrated, such that they work properly and provide us an accurate reading. But what if they don’t?
Now, imagine that new weighing tools have been developed and are getting increasingly used in grocery stores. Suppose that these tools have neither been calibrated nor tested at all prior to their usage. How would you feel if you were buying a food item that is priced by weight and you end up paying more due to a faulty scale that gives a heavier weight than the actual item weight? You would probably feel cheated when you found out the truth. Likewise, from the perspective of a business owner who sells priced-by-weight items, a broken scale could also mean losing money if it measures a lower weight than supposed. In both cases, the scale users suffer from negative consequences, which could have been avoided if the scales had been thoroughly checked for defects.
Following the ‘scale’ analogy, computer science researchers also use various scales, commonly known as ‘evaluation metrics’, to directly evaluate output from Artificial Intelligence (AI) models. Many types of AI evaluation metrics exist. Some metrics measure how accurate or how fast a model is. Other metrics quantify different aspects, e.g., related to responsible AI, such as fairness. While some fairness metrics have been used since nearly a decade ago, it was only recently that serious flaws within them and the way they are used were uncovered. We summarise three of the more worrying flaws below and what can be done about them.
| What is the problem with AI fairness for an everyday person, and why does it matter? Consider the case of applying for a job using an online hiring platform. In the platform, recruiters may utilise an AI model to find the top candidates for a job position. However, if the model is unfair, it may rank all male candidates above candidates with a different gender in a historically male-dominated area, e.g., software engineering. This could mean that other candidates, e.g., women, who are equally qualified to the top-ranked male candidates would have less chance to proceed to the next stage in the hiring pipeline, directly impacting their employment opportunity and possibly jeopardising their livelihood. |
Flaw 1: Overly simplistic evaluation setup that does not capture real-world complexity
AI fairness in computer science research is often evaluated for either groups or individuals. Group fairness typically ensures that when individuals are clustered into different groups according to a shared similarity, e.g., based on their sociodemographic identity, the different groups receive equitable outcome. For example, users with various sociodemographic background should receive equally good job recommendations from an AI application. On the other hand, individual fairness ensures that everyone receives equitable outcome.
Using the job recommendation example, this would mean that everyone should get equally good suggestions for job positions, regardless of their sociodemographic identity. Most research has focused only on group fairness; much fewer work has studied individual fairness. Group fairness evaluation requires personal demographic information of the AI users, which is often incomplete or unavailable. For example, there may only be information on a user’s latest education level, while their gender and ethnicity may be unknown. As such, fairness can only be evaluated for users from different education levels, leaving unfairness between other sociodemographic groups, e.g., based on gender or ethnicity, undetected. This evaluation approach also neglects the intersectionality of an individual’s identity by reducing it to a single variable, which may hide unfairness for intersectional groups (e.g., based on both their gender and ethnicity). Ergo, the evaluation of fairness becomes too simplistic as it does not capture the intersection of sociodemographic characteristics that are present in the real world.
To complicate matters, group and individual fairness are usually evaluated with different metrics. Different metrics may have different sensitivity; a similar change in fairness level could increase/decrease two metric scores differently. As a result, the metric scores are not directly comparable, which makes it hard to understand how improving group fairness may affect individual fairness, and vice versa.
What is the problem for an everyday person and why does it matter?
If AI models are only optimised for a specific type of fairness, (e.g., fairness for groups, with only one way of forming the groups), they can still be unfair towards other marginalised, intersectional groups or individuals. This means that on average, the models can perform comparably well for two groups of people, but an everyday person may knowingly or unknowingly belong to a smaller part of the group, for whom the models perform poorly. This is a problem, as AI models should ideally be able to perform equally well for everyone.
How have we fixed this in our work?
We experimented with several Large Language Models (LLMs) to recommend relevant job titles to job applicants. Using Gini Index, we evaluated the overall individual fairness, fairness within each group of applicants, as well as fairness for different applicant groups. The groups are based on the applicants’ latest education level (degree), years of experience, their study major, and a combination of them. We found two interesting results. Firstly, the recommendation can be very fair for different groups of applicants, but highly unfair for individuals within each group and overall. This means that while recommendation quality only differs a little for different applicant groups, it varies heavily when considering all applicants, showing the need to evaluate for both group and individual fairness. Secondly, we showed that the same recommendations that are relatively fair for applicants when they are grouped using only one variable (e.g., degree) is much more unfair when intersectionality is considered (e.g., using both degree and study major) in forming the groups. In other words, an overly simplified evaluation setup may not suffice to provide a complete picture of fairness, especially while other forms of unfairness take place.
How can our solution be used by practitioners?
For comparable evaluation for group and individual fairness, practitioners can measure both of them with the same metrics, as we did. Furthermore, when evaluating group fairness, practitioners should consider the intersectionality of the individual’s identities, as otherwise unfairness for the minority or intersectional groups may go undetected.
Where can I find out more about this?
You can get a short overview of the research from our online poster here and read the paper here. We also provide the exact formulations of the metrics and the code to compute them here.
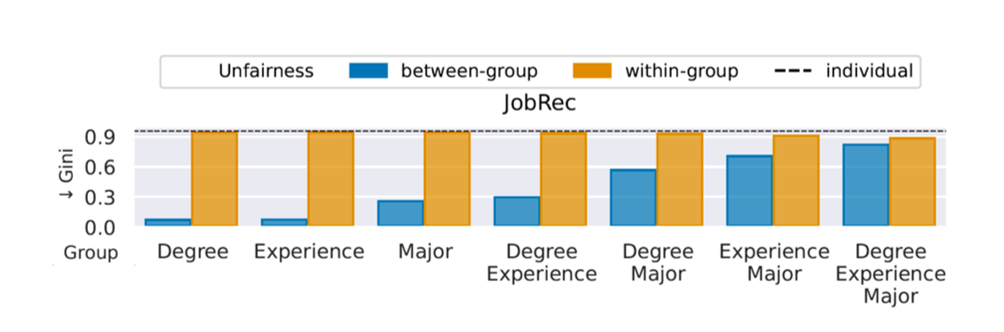
| Figure 1: The figure refers to the job recommendation (JobRec) task. Columns represent different ways of grouping users by attributes: degree, years of experience, and study major. For example, “degree – major” means that groups are formed by users with the same degree and study major. Bars report the unfairness score for the disparity in recommendation effectiveness measured with Gini Index (Gini), where lower Gini is fairer. The figure shows that between-group unfairness, the blue bars, tends to be very low, that is, recommender models are deemed fair, especially when groups are formed with 1 or 2 attributes. On the other hand, within-group unfairness, the orange bars, and individual fairness, the dashed line, are higher. This means that the same recommender model is deemed unfair when considering all individuals or individuals within each group. The figure is modified from Rampisela et al. [2025b]. |
Flaw 2: The minimum or maximum possible score of some evaluation metrics is not known
Suppose a lower metric score that is close to zero means better fairness (e.g., zero unfairness). From this information alone, it is not possible to tell whether a score of 0.3 is good. If the maximum possible score is 1, we can reason that 0.3 is closer to 0 than to 1, and thus can be interpreted as a somewhat good score. On the other hand, if the maximum possible score is 0.5 instead, then 0.3 is closer to the worst possible score, and may not seem that good anymore. Without knowing both the lower and upper limits of a metric, its score cannot be easily interpreted. In some cases, not knowing the maximum and minimum scores can mislead the comparison across AI models.
What is the problem for an everyday person and why does it matter?
An everyday person might want to know which AI model is the fairest. Even if the fairness scores of several AI models are known, this information cannot be directly used to find out the best model in terms of fairest, if the minimum/maximum score may differ per model. As such, it is hard for the public to judge how fair an AI model is, compared to another model.
What causes this problem computationally?
For some fairness metrics, the maximum and minimum scores vary depending on the AI model and cannot be known a priori from the metric equation. For example, let us assume that for one model the fairness scores are in the range 0–1 and for another model they are in 0.5–1. The lower the score, the better the model fairness. In this example, the first model has more chances to be considered fairer even when it is not the case, simply because it is evaluated with a different scale, which has a lower minimum score. In other words, the scores of the two AI models are not comparable because they are in different ranges.
How have we fixed this in our work?
We modify the input to the metric, such that for all AI models that we compare, the metric is computed on a reference data that does not depend on the AI model. An example of such reference data in recommendation tasks could be the user preference data that indicates whether a user likes the recommendation given to them. As all models are computed based on the same reference data, the comparison across models will be possible.
How can our solution be used by practitioners?
For proper comparison across models, practitioners can consider adopting our evaluation approach of using model-independent reference data, especially when comparing two or more AI models. Furthermore, practitioners can now be aware which metrics have unknown minimum or maximum possible scores. When these metrics are used, they should not be described with intensifier words, such as “very”. For example, it is not appropriate to say that a fairness metric score of 0.3 is “very good”, when we do not know whether it is closer to the best or worst possible score.
Where can I find out more about this?
You can read our open-access paper here and find the metrics here.
Flaw 3: Some metrics cannot reach their minimum or maximum score
While some metrics are known to range between 0 and 1 in theory, their scores in practice may not actually reach these numbers, depending on both the dataset size and other variables such as the AI configuration. For example, suppose that the lower the score the better, that is, the more fair the model. The reachable minimum and maximum scores may be 0.3 and 0.6, respectively, instead of 0 and 1.
What is the problem for an everyday person and why does it matter?
Not knowing the reachable worst/best possible scores can lead to two issues: Firstly, a model score of 0.5 may not seem too bad to an everyday person, considering the 0–1 range. One could interpret this score to be somewhat fair. However, upon having additional knowledge that the reachable values are actually in 0.3–0.6, the 0.5 score would seem much worse as it is now closer to the worst reachable score. Hence, such metric scores could mislead and affect our interpretation of how fair a model is. Secondly, if a model scores 0.3, one might want to try to find a model that scores better, while this would be impossible. In this case, not knowing the reachable minimum score may lead to futile efforts to find another model with a better score, as any kind of AI model output would not produce a score below 0.3.
What causes this problem computationally?
This happens because some metrics are formulated based on ideas or assumptions that do not exactly match real data or common evaluation setup. For example, Gini Index can be used to measure recommendation unfairness, but the score can only reach 1 (the most unfair score) if there is only one item that is recommended to everyone. This is an unrealistic scenario, as users will always be recommended a fixed number of items, usually 10. Due to this type of mismatch, the metrics cannot reach their minimum or maximum score.
How have we fixed this in our work?
For some metrics, we corrected their scores by creating a mapping that rescales their range to be between 0 and 1, that is, the theoretical minimum and maximum can be reached by the models. This way, a score of 0 would now correctly mean the best possible outcome, and a score of 1 would mean the worst possible outcome. Yet, making such a mapping is not always easy, especially when the metric equation has many variables. In some cases, it is not even possible to know what kind of model output results in the best/worst possible metric score.
How can our solution be used by practitioners?
Practitioners can directly use our corrected metrics for the same evaluation setup that we used. If the evaluations setup differs, we encourage practitioners to consider applying similar ideas to rescale the metrics, when needed.
Where can I find out more about this?
You can view our poster that summarises the issue and solution here, watch our recorded presentation on YouTube (in English), or listen to this podcast (in Indonesian). The corrected metrics can be found here. Our open-access paper can be read here.

| Figure 2: Unfairness metric scores for artificial recommendation with synthetic data, before and after they are corrected to map the fairest recommendation to 0 and the unfairest to 1. The lines in the figure are different fairness measures: Inequity of Amortized Attention (IAA) and Individual-user-to-individual-item fairness (II-F). Both measures are the lower the better, that is, the closer to zero the score, the more fair the model. In this experiment, we artificially generate recommendation lists of items with an increasing amount of fair items. We would expect both measures to initially score the worst possible, close to 1, and then gradually improve, that is, their scores decrease and become close to zero as more fair items are added (when we move from left to right in the x-axis). However, Figure 2 (left) shows that both measures are not very sensitive to changes, so when adding fair items, there are negligible changes in the measure scores (note that the scales of the y-axes are different between the two figures). Moreover, we can see that both measures have scores very close to zero, on the left side of the x-axis. This means that even when the recommendation lists contain a majority of non-fair items, the measure score is already close to the perfectly fair scenario. By considering these very low scores, one might conclude that the recommendations are fair even in extremely unfair cases. Figure 2 (right) shows our rescaled version of the measures. Both measures behave as expected, starting from the unfairest score of 1 and reaching the fairest score of 0, when more fair items are added. Modified from Rampisela et al. [2025a]. |
Our Guidelines:
• Evaluate for both group and individual fairness. A recommender model can be fair to a group, but at the same time highly unfair for individuals in the group. For example, a recommender model might be fair across different genders, but if we consider a specific gender group, e.g., female, the model still discriminates against female users based on ethnicity.
• Use our corrected measures to evaluate absolute fairness, that is, to evaluate the fairness of a recommender model in isolation, for example, to determine how fair a model is or how far it is from the perfectly fair model.
• Be careful when interpreting the measure scores. Some measures have a skewed distribution, so they tend to return scores that are very close to the perfectly fair scenario. However, this does not mean that the models are almost perfectly fair and the consequence might be overestimation of fairness.
The above list of flaws is non-exhaustive; other evaluation metrics for AI may suffer from different issues that are equally significant. As a result of these flaws, the metric scores can be confusing to interpret or even fail to be computed at all. While some flaws can be easily mitigated, others are not so straightforward. Similar to weighing scales in our day-to-day life, the metrics should also be analysed, tested, and calibrated before they are put into use, to ensure that their scores are not misleading. Overall, there is a dire need to scrutinise not only the AI model and the data used to train them, but also the way AI fairness is evaluated through existing metrics, such that their scores can accurately illustrate the intended aspects and be easily understood.
References:
T. V. Rampisela, M. Maistro, T. Ruotsalo, F. Scholer, and C. Lioma. Relevanceaware individual item fairness measures for recommender systems: Limitations and usage guidelines. ACM Trans. Recomm. Syst., Sept. 2025a. doi: 10.1145/3765624. URL https://doi.org/10.1145/3765624. Just Accepted.
T. V. Rampisela, M. Maistro, T. Ruotsalo, F. Scholer, and C. Lioma. Stairway to fairness: Connecting group and individual fairness. In Proceedings of the Nineteenth ACM Conference on Recommender Systems, RecSys ’25, page 677–683, New York, NY, USA, 2025b. Association for Computing Machinery. ISBN 9798400713644. doi: 10.1145/3705328.3748031. URL https://doi. org/10.1145/3705328.3748031